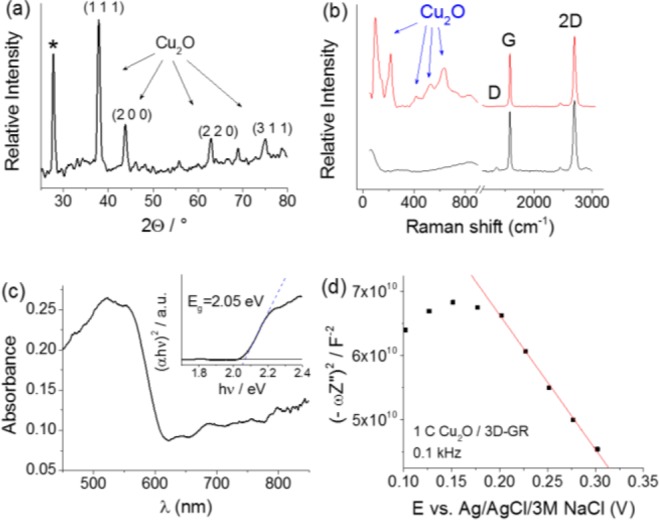
Figure 5.

(a) XRD pattern, (b) Raman spectrum (also for the bare 3D-GR sample), (c) Diffuse-reflectance UV–vis spectrum (together with Tauc representation as inset), and (d) Mott–Schottky plot (recorded in 0.1 M NaAc solution), of a Cu2O/3D-GR composite, deposited with 1 C cm–2 charge density. The diffraction marked with asterisk in (a) corresponds to the graphene substrate.
