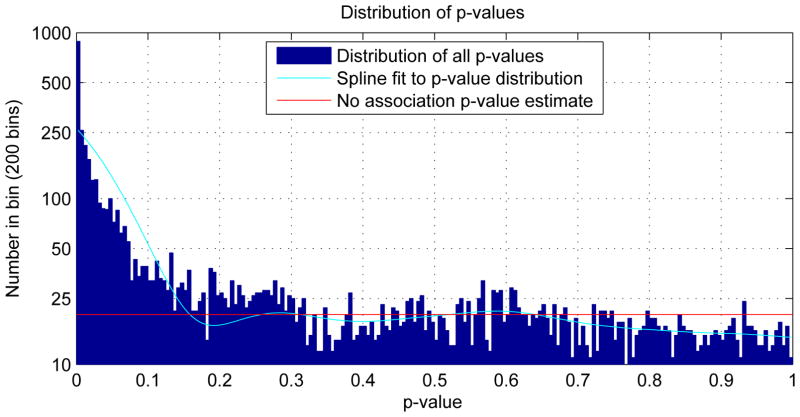
Figure 3.
Distribution of observed p-values and a conservative estimate of the distribution of the p-values of the cases in which there were no genotypic associations in the data. There were 6288 observed p-values of which 4000 were estimated to be instances with no genotypic association. The bins are .005 wide. This plot corresponds to figure 1 in Storey and Tibshirani (2003).

