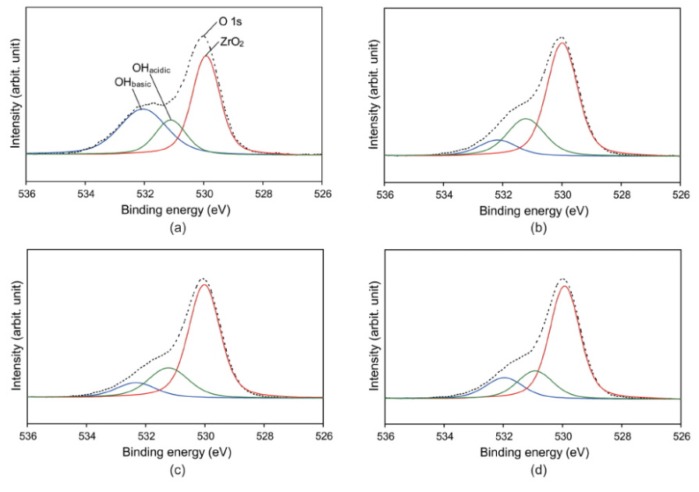
Figure 5.
High-resolution X-ray photoelectron spectroscopy (XPS) spectra of O 1s region of untreated (a) and plasma-treated (b–d) zirconia surfaces: groups P-I (b); P-W (c); and P-A (d). Deconvolution of O 1s high resolution spectrum resulted in three components: basic hydroxyl groups at 532.6 eV, acidic hydroxyl groups at 531.8 eV, and ZrO2 at 530.2 eV.

