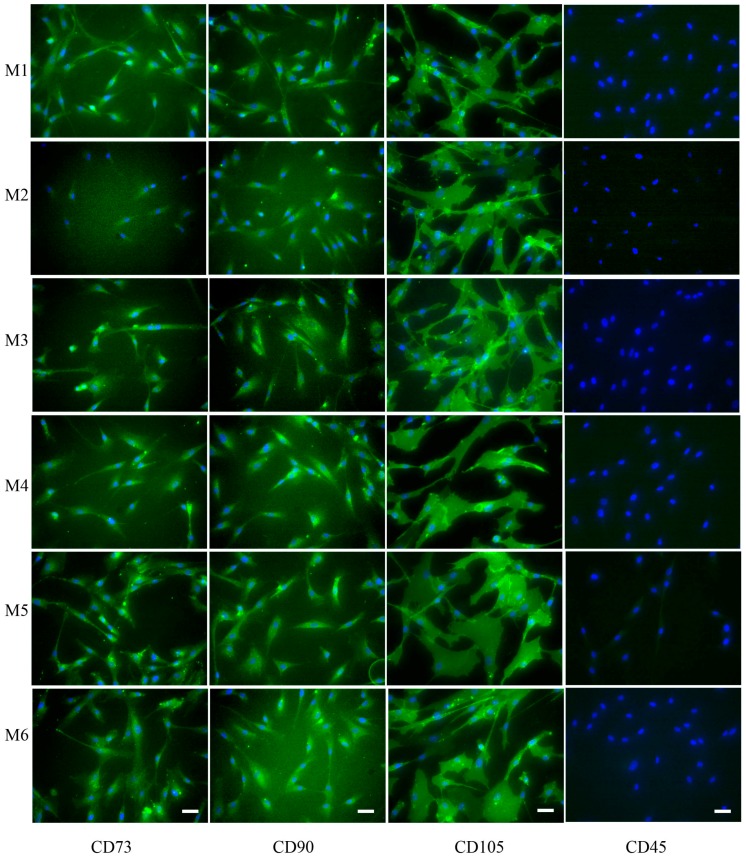
Figure 5.
Representative of the immunocytochemical assay of hMSC-associated markers (CD73, CD90, and CD105), and CD45 after the cells were cultivated on various coated glass samples for 48 h. Silicon wafers coated under higher oxygen (M1), nitrogen (M2), and argon (M3) pressures and under lower oxygen (M4), nitrogen (M5), and argon (M6) pressures. Scale bar is 25 µm.

