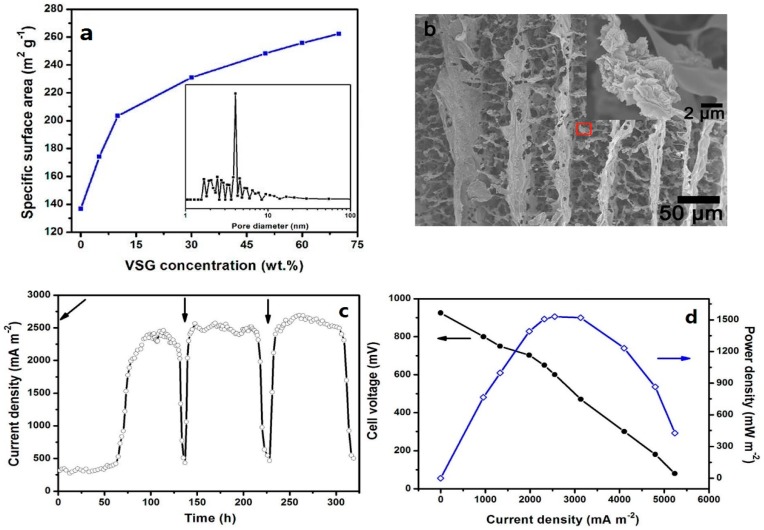
Figure 6.
(a) The plot of the specific surface area increasing with the vacuum-stripped graphene concentration of the chitosan/vacuum-stripped graphene (CHI/VSG) scaffolds; (b) CHI/VSG-50 scaffold; Constant-load discharge curve (c); and power density and polarization curves (d) of the microbial fuel cells based on the CHI/VSG-50 anode. Arrows of (c) indicate the time of glucose feeding. Adapted from [68], with permission from © 2012 American Chemical Society.

