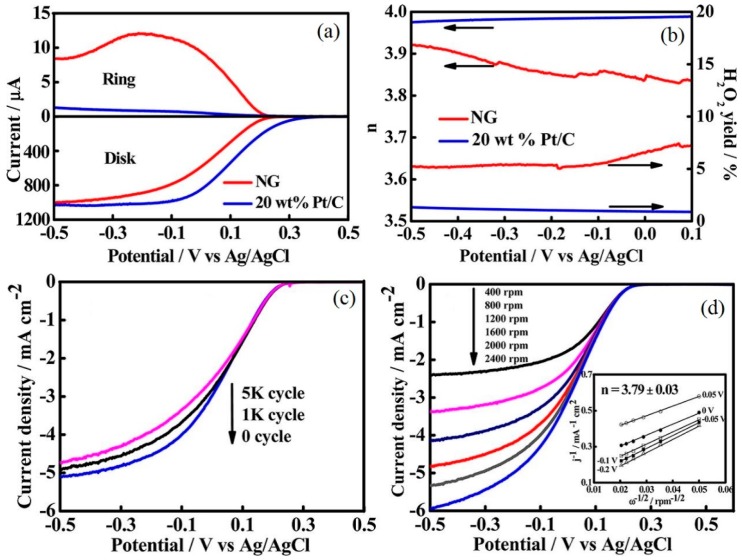
Figure 10.
Variation of disk and ring currents on nitrogen-doped graphene (NG) cathode and Pt/C cathode as a function of the potential at a rotation rate of 1600 rpm (a); and the corresponding H2O2 yield and electron transfer number (n) as a function of the potential (b). Polarization curves (j-V relationship, where j is represent for the current density) of oxygen reduction reaction (ORR) at NG cathode (c) after varying the potential cycles at a rotation rate of 1600 rpm, and (b) at varied rotation rates after 5000 cycles, inset (d) shows the Koutecky-Levich (k-l) plots. Adapted from [50], with permission from © 2013 American Chemical Society.

