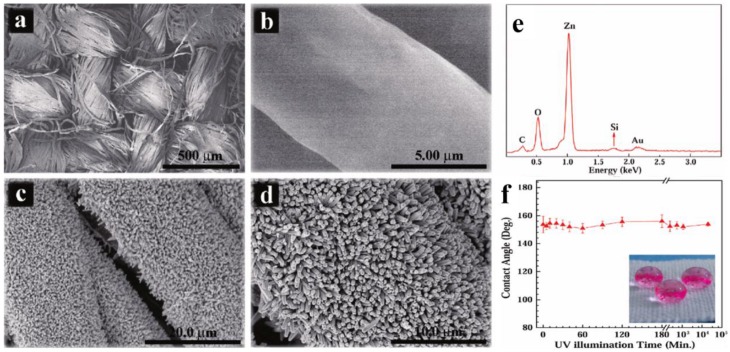
Figure 19.
SEM images of native (a,b) and ZnO nanorod array coated (c,d) cotton textiles; (e) EDX spectrum of the sample corresponding to image (e); (f) Evolution of water CA on an OTS-modified ZnO@SiO2 nanorodarray coated cotton textile under UV irradiation (25 mW·cm−1). The x-axis after the break is scaled logarithmically. The inset is a macroscopic view of water droplets on the surface of a UV-irradiated sample. (Reprinted from Reference [185] with permission).

