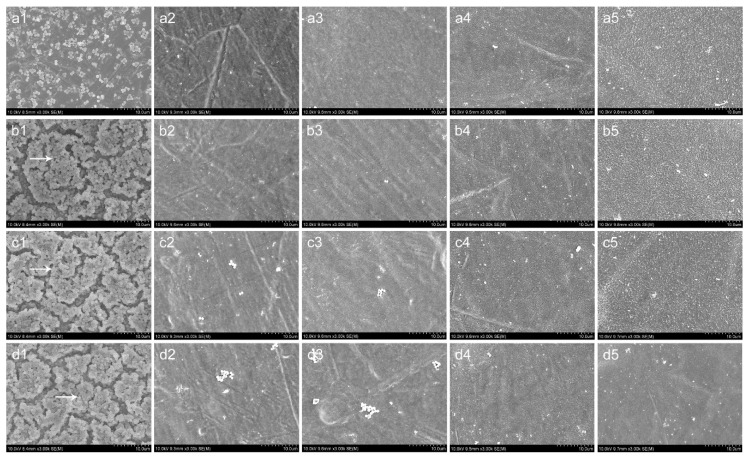
Figure 5.
SEM images of ATCC 43300 adhesion and biofilm formation on different surfaces. (1) Smooth Ti; (2) NT-H80; (3) NT-H120; (4) NT-H160; (5) NT-H200 after (a) 6 h; (b) 24 h; (c) 48 h; and (d) 72 h incubation. Arrow head indicates the bacteria colony in biofilm. The magnification level is ×3,000. The scale bar is 10 µm.

