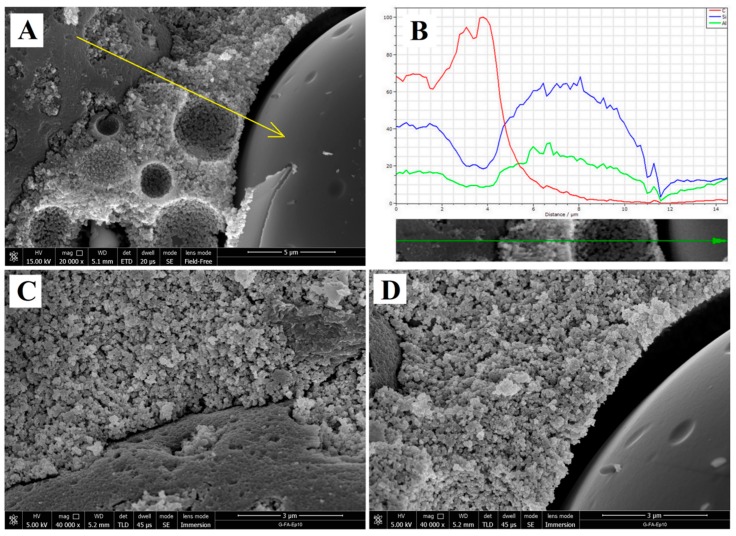
Figure 8.
SEM image of the sample G-FA-Ep10: (A): magnification at 20,000× of a part of Figure 6B’ that shows, following the direction of the yellow arrow: (i) the resin particle; (ii) the matrix and (iii) the not-reacted ash particle; (B) % distribution of C (red), Si (blue), Al (green) along the arrow obtained by EDS analyses; (C,D) 40,000× magnification image of the interface zone between the geopolymer matrix and a resin particle, and between the matrix and an ash particle, respectively.

