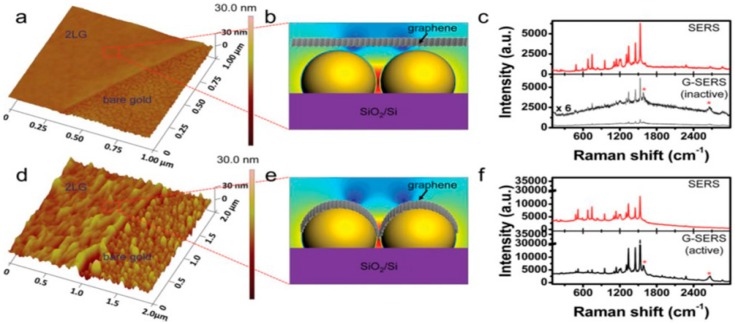
Figure 12.
Morphology-dependent SERS performance of normal SERS and graphene-mediated SERS (G-SERS). (a,d) AFM images of a bilayer graphene (2LG)-covered 8-nm gold film (a) before, and (d) after annealing, showing both the bare gold regions and graphene-covered regions; (b,e) Schematic illustration of the contact state between graphene and AuNS correspond to the enlarged regions; (c,f) SERS performance of normal SERS (top) and G-SERS regions (bottom) (c) before, and (f) after annealing, respectively. “*” marks the G and G′ band of the 2LG. The figure is adapted from [198], with permission from ©2013 Wiley.

