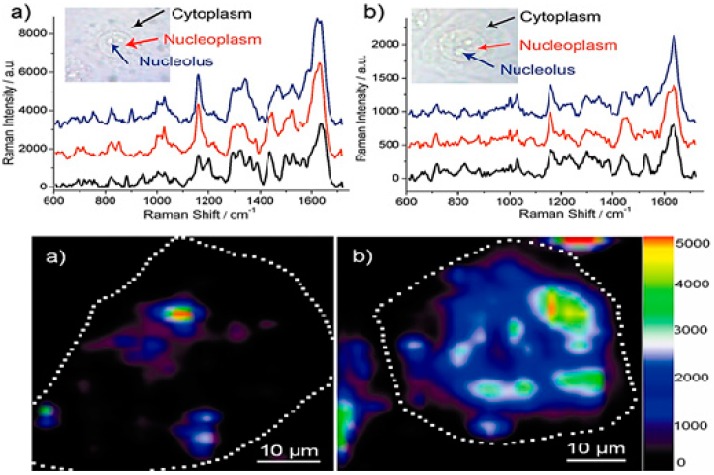
Figure 13.
In the upper (a) GO/PVP/IGAuNPs and (b) IGAuNPs—SERS spectra of A549 cells collected from the regions corresponding to the cytoplasm, nucleoplasm, and nucleolus. In the lower—typical SERS images of A549 cells contained with (a) IGAuNPs or (b) GO/PVP/IGAuNPs, showing the distribution of gold nanostructures inside the cell. The dotted lines in the images are drawn to indicate the boundaries of select cells. Adapted from [220], with permission from ©2012 American Chemical Society.

