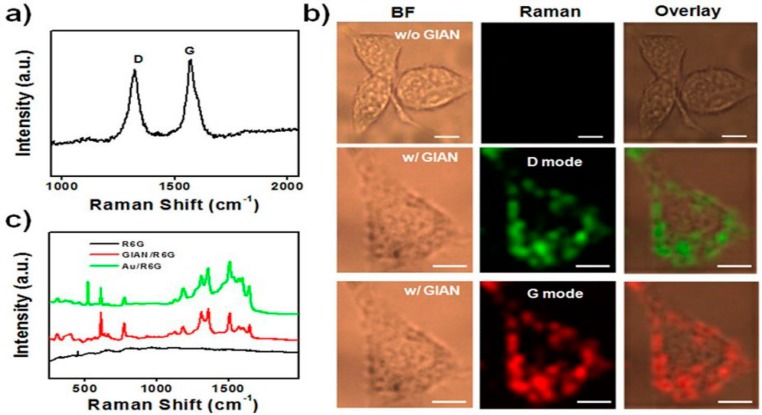
Figure 15.
(a) Raman spectrum (excitation at 632 nm) of GIANs showing the G and D bands of graphitic carbon; (b) Raman imaging of MCF-7 cells with and without GIAN staining. BF: bright field, scale bar: 10 μm; (c) Raman spectra of R6G molecules, with and without GIAN, and with AuNPs, respectively. The figures are adapted from [138], with permission from ©2014 Nature Publishing Group.

