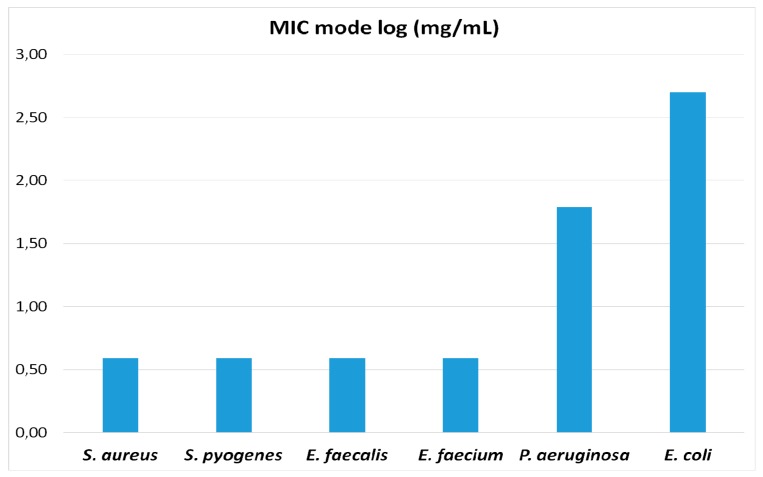
Figure 2.
MIC values within groups follow a modal distribution. MIC mode values (expressed as log10) for the different bacterial species assayed are represented in the figure. The four Gram-positive species (S. aureus, S. pyogenes, E. faecalis, E. faecium) exhibit equal values of MIC mode, while the MIC mode values against the two Gram-negative species (P. aeruginosa and E. coli) are much higher (E. coli > P. aeruginosa).

