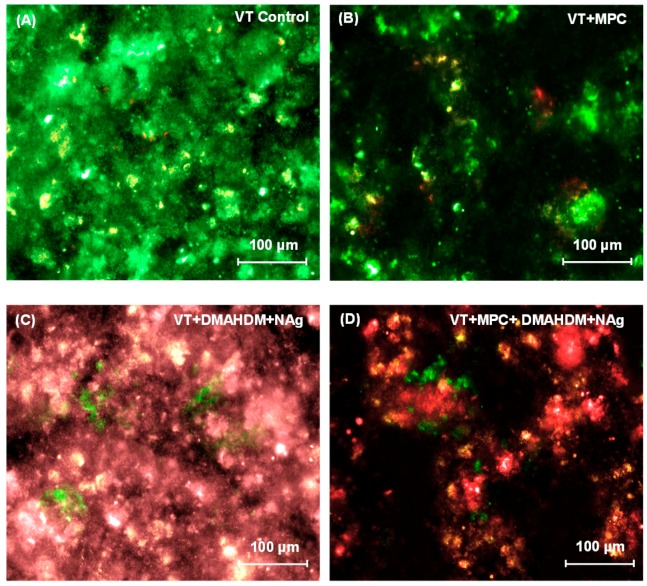
Figure 3.
Representative live/dead images of 2-day biofilms on: (A) VT control; (B) VT + MPC; (C) VT + DMAHDM + NAg; and (D) VT + MPC + DMAHDM + NAg. Live bacteria were stained green, and compromised bacteria were stained red. When live and dead bacteria were in close proximity or on the top of each other, the staining had yellow or orange colors. VT + MPC + DMAHDM + NAg had less bacterial adhesion, and the biofilms consisted of primarily compromised bacteria.

