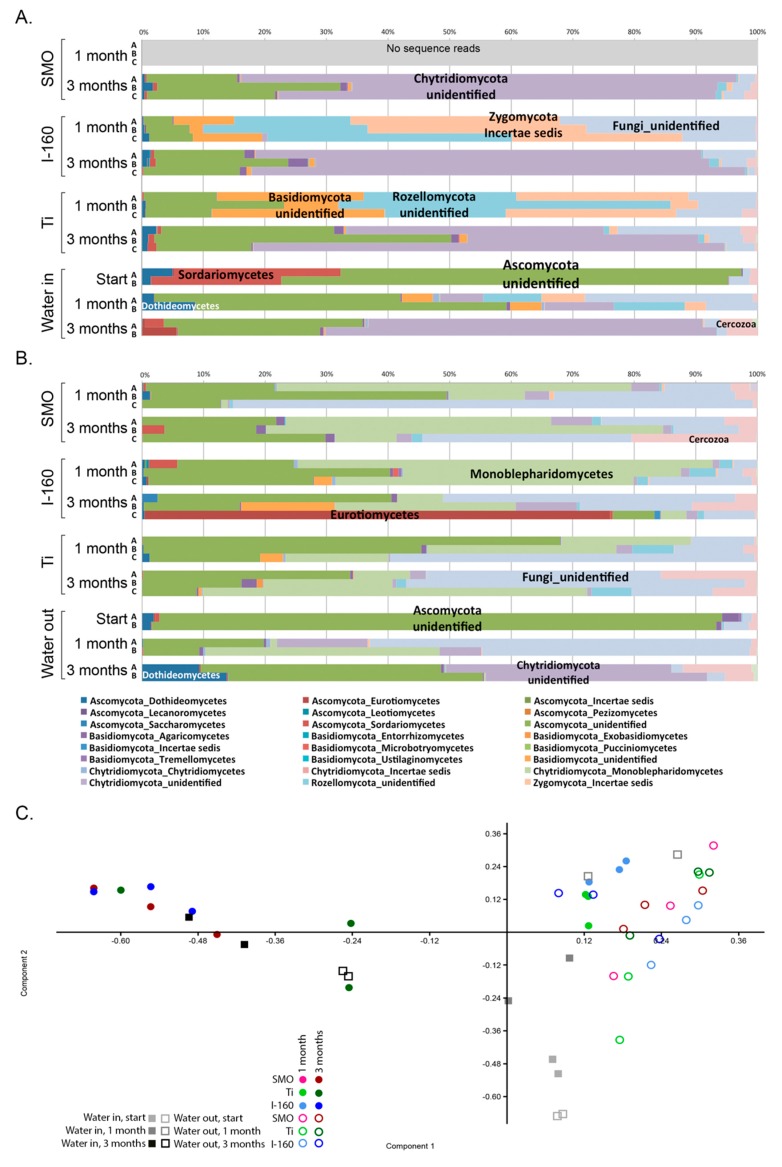
Figure 8.
The fungal community composition of (A) the non-chlorinated and (B) chlorinated samples; (C) a PCA plot based on the fungal community (family level). In (C), open symbols indicate chlorinated and solid symbols non-chlorinated samples. Component 1 explains 36.7% and Component 2 explains 22.6% of the variance of the variance with Monoblepharidomycetes, unidentified Chytridiomycota and unidentified Fungi determining the loadings of PC1 and unidentified Ascomycota determining the loadings of PC2.

