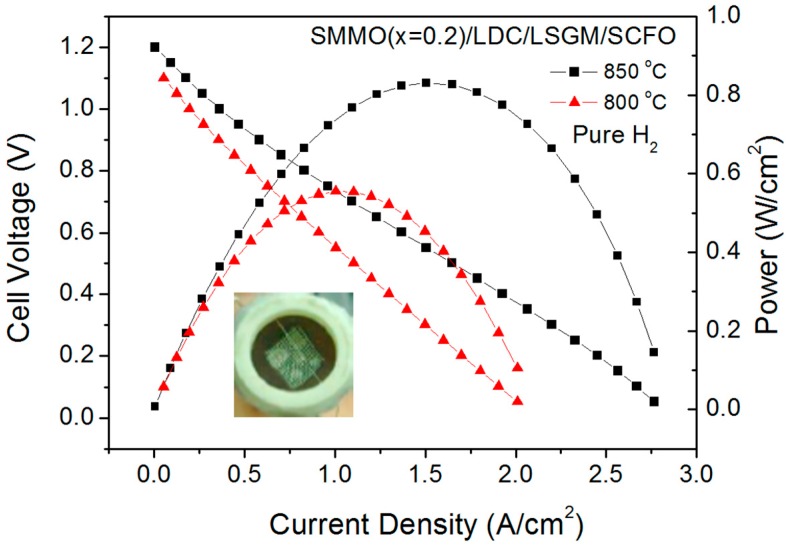
Figure 13.
Cell voltage (left axis) and power density (right axis) as a function of the current density for the test cell with the configuration SMMO (x = 0.2)/lanthanum-dope ceria (LDC)/LSGM/SCFO in pure H2 measured at T = 800 and 850 °C. The inset shows a view of the cathodic side of the single cell.

