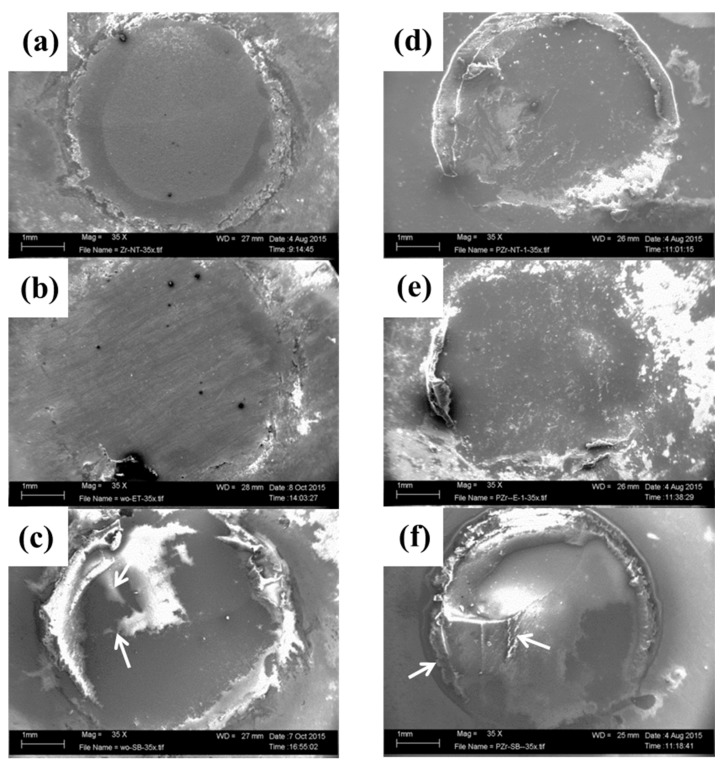
Figure 6.
SEM micrograph (35× magnification) from each experimental group without thermocycling. (a) NT; (b) ET; (c) SB; (d) C-NT; (e) C-ET; and (f) C-SB. Abbreviations of each experimental group are shown in Table 2, respectively. (+) indicates thermocycled samples. White arrows indicate cement residues.

