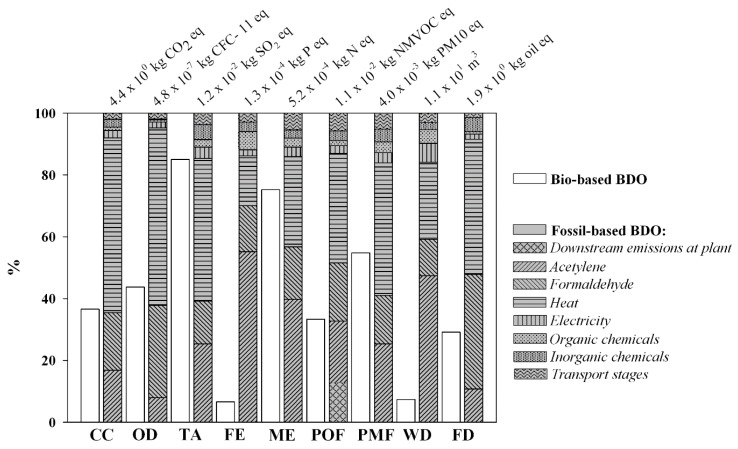
Figure 4.
The characterization graph shows the comparison between 1 kg of bio-based BDO and 1 kg of fossil-based BDO. The figure also details the contribution from the different input process to the total impacts of the fossil-based BDO production (“butane-1,4-diol, at plant” record, from EcoInvent database v. 2.02).

