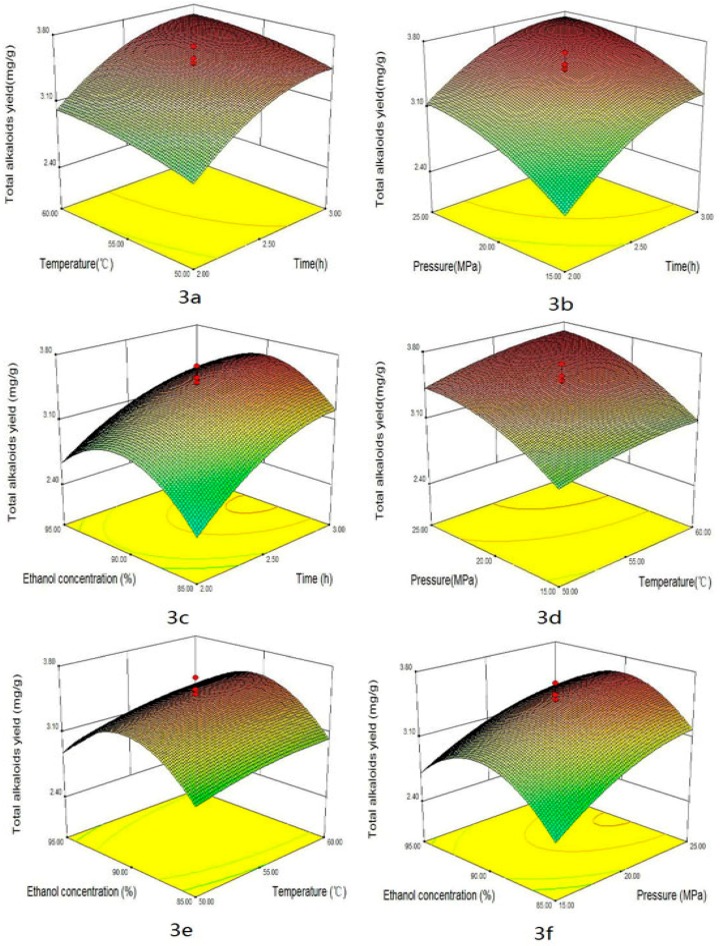
Figure 3.
Response surface plots of total alkaloids yields showing: (a) the effect of time and temperature at constant pressure (20 MPa) and ethanol concentration (90%); (b) the effect of time and pressure at constant temperature (55 °C) and ethanol concentration (90%); (c) the effect of time and ethanol concentration at constant temperature (55 °C) and pressure (20 MPa); (d) the effect of temperature and pressure at constant time (2.5 h) and ethanol concentration (90%); (e) the effect of temperature and ethanol concentration at constant time (2.5 h) and pressure (20 MPa); and (f) the effect of pressure and ethanol concentration at constant time (2.5 h) and temperature (55 °C).

