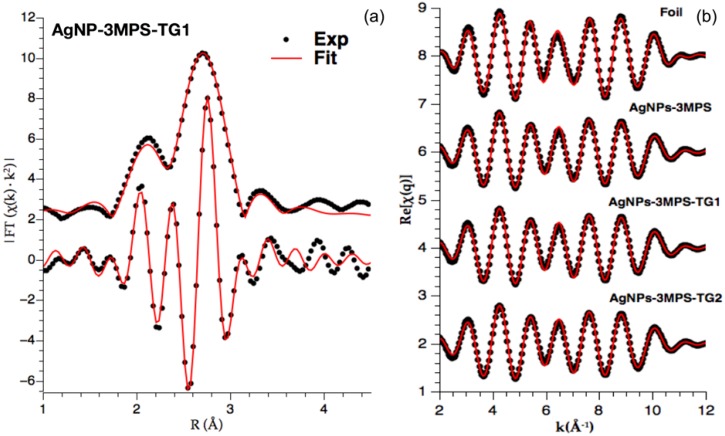
Figure 4.
Graphical results of EXAFS analysis: (a) Example of EXAFS best fit analysis on Ag-3MPS-TG2 sample: Ag K-edge k2 weighted Fourier transform modulus (top curves) and imaginary part (bottom curves): experimental (points) and best fit (red full lines) shifted for clarity. The fit takes into account only Ag–Ag single scattering signal path present in first shell; (b) Fourier filtered experimental (points) and best fit (ful lines) for reference Ag foil and NPs, vertically shifted for clarity.

