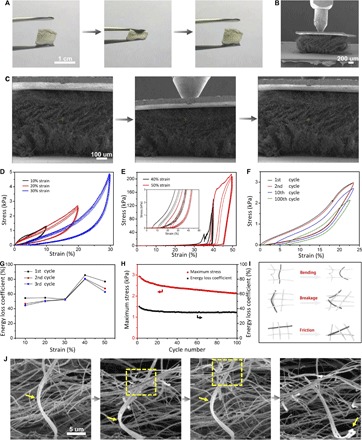
Fig. 2. Compressive test results of TiO2 nanofiber sponge with a density of ~35 mg/cm3 at room temperature.

(A) Compression and recovery processes of macroscopic TiO2 sponge. (B) SEM image of TiO2 sponge pressed by a nanoindenter. (C) In situ SEM images of compressive process of TiO2 sponge. (D and E) Cyclic compressive stress-strain curves of TiO2 sponge under 10 to 50% strain. Each test was repeated for three cycles, and the inset shows the magnification of initial part of curves in (E). (F) Cyclic compressive stress-strain curves of TiO2 sponge under 23% strain for 100 cycles. (G) Energy loss coefficient of sponge compressed for three cycles by 10 to 50% strain in (D) and (E). (H) Variation of energy loss coefficient and maximum stress with cycle number of TiO2 sponge in (F). (I) Schematic of energy dissipation mechanisms. (J) Zoomed-in SEM images during the compression process, showing the bending and springback of a hank of nanofibers and the friction of neighboring nanofibers, and the fourth picture shows their breakage after some cycles.
