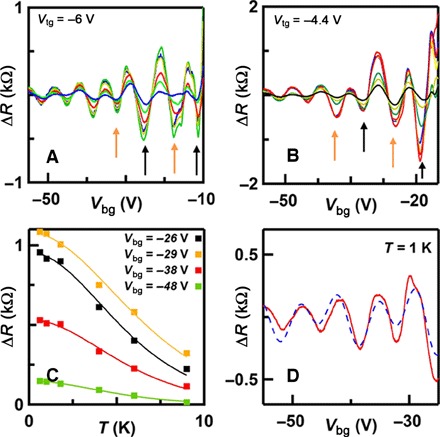
Fig. 3. Quantum oscillations at B = 18 T.

(A) Background-subtracted resistance ΔR at Vtg = −6 V and T = 0.6, 1, 1.8, 4, 6, and 9 K, respectively. Arrows indicate nonmonotonic amplitude dependence on density. (B) Similar data set at Vtg = −4.4 V. (C) Oscillation amplitude as a function of temperature at Vtg = −3 V and different Vbg values (squares), fitted to Lifshitz-Kosevich formula (solid lines). The fits yield an effective mass m* ~ 0.43 ± 0.1 me. (D) ΔR(Vbg) at Vtg = 0 V and T = 1 K (solid lines) and fitted curve using Eq. 1 (dashed line), TD = 2 K and gm* = 1.15.
