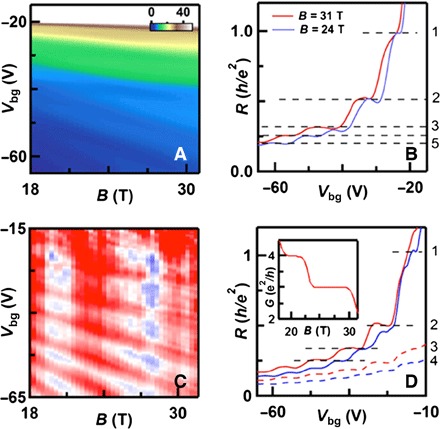
Fig. 4. QH states at high magnetic field.

(A) R(Vbg, B) with the top gate disconnected for 18 < B < 31 T. Quantized plateaus at filling factors ν = 1, 2, 3, 4, 5, and 6 are observed. (B) Line traces of (A) at B = 24 T (blue) and B = 31 T (red), respectively. The dashed lines mark expected values of resistance plateaus. (C) Differentiated dR/dB(Vbg, B) at Vtg = −8 V. (D) Line traces of (D) at B = 20.3 T (blue) and B = 27.7 T (red). The dashed lines correspond to raw data, and solid lines are obtained by subtracting parallel conductance contributed by top surface states. Inset: Calculated conductance of the top surface states at Vtg as a function of B.
