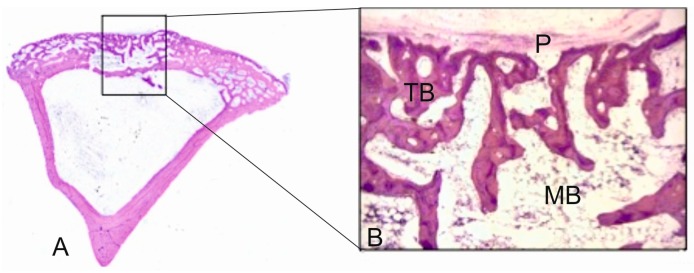
Figure 4.
(A) Panoramic image of the control sample after three months of healing (31.2×); (B) representative histological microphotograph showing the bone defect partially filled with the newly formed trabecular bone (TB), hematopoietic bone marrow (BM) and periosteum layer (P) on the surface (125×).

