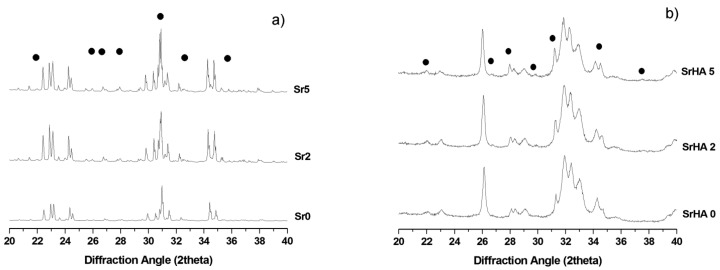
Figure 1.
XRD diffraction profiles of: (a) cement precursors with different Sr content (Sr/Ca: 0–5 mol %); (b) the corresponding hardened cements after 3 days of incubation at 37 °C. The • symbol indicates the peaks belonging to βTCP phase. In Figure 1a the non-indexed peaks address αTCP phase, whereas in Figure 1b, the HA phase.

