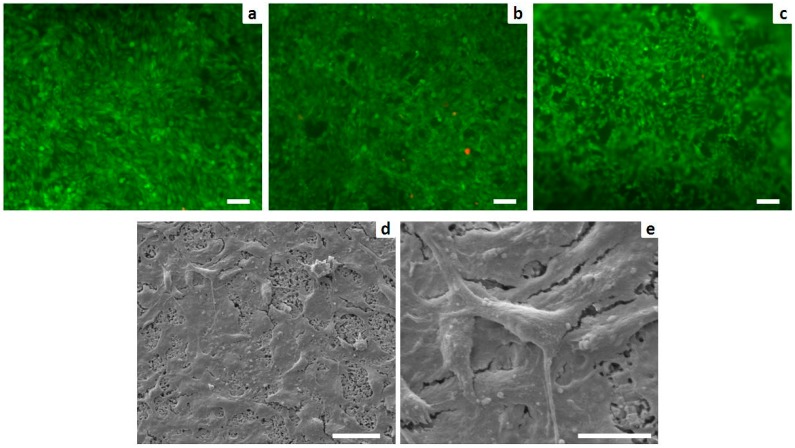
Figure 8.
Cell viability analyzed by the live/dead assay: Calcein AM stains for live cells in green, EthD-1 stains for dead cells in red. (a) Sr0; (b) Sr2; and (c) Sr5 (scale bars: 100 µm); and analysis of cell morphology assessed by SEM: (d) MG63 grown for three days on Sr2 surface (scale bar: 50 µm) with a higher power view showing details of the cell plasma extensions (e) (scale bar: 20 µm).

