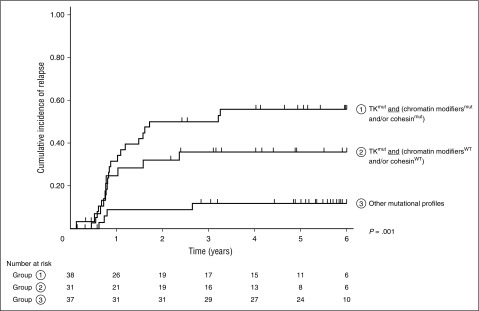
Figure 2.
Kaplan-Meier curves for CIR in patients stratified according to their mutational profile. Patients are separated in 3 groups: (1) TK pathway mutation associated with at least 1 mutation involving chromatin modifier or cohesin genes, (2) TK pathway mutation without mutations involving chromatin modifier or cohesin genes, and (3) other mutational profiles.

