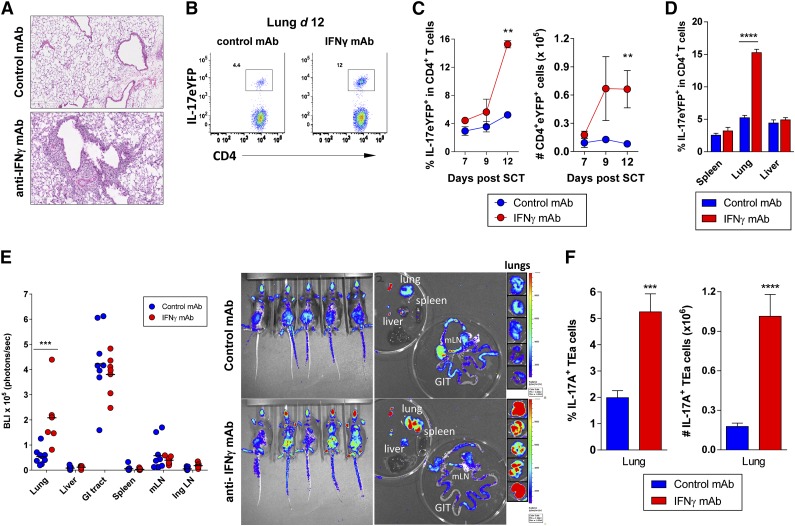
Figure 5.
Th17 cells accumulate specifically in the lungs in the absence of IFN-γ signaling. Splenocytes from G-CSF mobilized B6.IL-17-eYFP fate map reporter donors (A-D) or TEa TCR transgenic donors (E-F) were transplanted into lethally irradiated B6D2F1 recipients (n = 3 to 6 per group). Control or anti–IFN-γ mAb (500 μg/dose) was administered every alternate day starting from day 0 and tissues harvested on days 7, 9, or 12. (A) Representative lung pathology in control vs IFN-γ blocked allograft recipients at day 12 post-SCT are shown. (B) Representative dot plots showing the frequency of donor CD4+ IL-17eYFP+ T cells in lung tissue at day 12 post-SCT with anti–IFN-γ or control mAb treatment. (C) Time course data showing accumulation of donor CD4+ IL-17eYFP+ T cells in the lung over time ± IFN-γ blockade. **P = .002, control vs IFN-γ treated groups at day 12. (D) Comparison of donor CD4+ IL-17eYFP+ T-cell frequencies at day 12 post-SCT in different tissues ± IFN-γ blockade. ****P < .0001, control vs IFN-γ treated groups. (E) Alloantigen-specific TEa transgenic T-cell expansion in whole body and individual organs at day 12 post-SCT. Quantified luciferin signals (left) and representative bioluminescence images (right) are shown (n = 7 to 9 per group). Light emission is presented as photons per second per cm2 per steer radiant (ph s−1 cm−2 sr−1). Total flux of organ is presented as photons per second (ph s−1). Lung BLI: ***P = .0003, control vs IFN-γ treated groups. (F) Frequency and absolute number of IL-17A+ TEa T cells in lung at day 12 post-SCT ± IFN-γ blockade (n = 10 per group). ***P = .0007, ****P < .0001, control vs IFN-γ treated groups. All data representative of at least 2 combined replicate experiments. Ing LN, inguinal lymph node; mLN = mesenteric lymph node.

