. 2017 May 24;6:e25637. doi: 10.7554/eLife.25637

Figure 7. Comparison of PAR-CLIP and ChIP-Seq occupancy profiles.

Averaged ChIP-Seq (red) and PAR-CLIP (blue) occupancy profiles of EFs and ChIP-Seq of the histone marks H3K4me3, H3K79me3 and H3K36me3 (yellow) centered around TSSs [−150 bp to +600 bp] and pA sites [−600 bp to +150 bp] individually normalized to range between 0 and 1.

DOI: http://dx.doi.org/10.7554/eLife.25637.014

Figure 7.

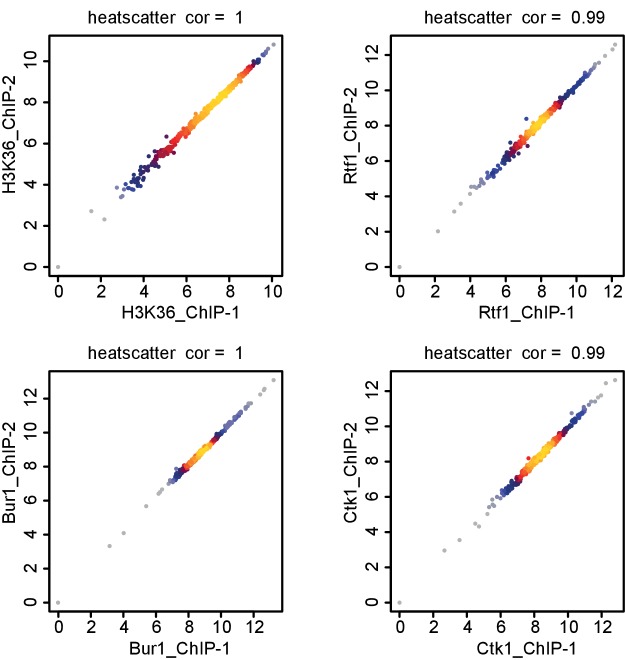
Figure 7—figure supplement 1. Comparison of replicate measurements for ChIP-Seq.

Figure 7—figure supplement 1.

Comparison of ChIP-Seq IP replicate measurements for elongation factors Bur1, Ctk1 and Rtf1 and histone methylation mark H3K36me3. The scatterplots compare average log2 read counts of all transcripts shown in Figure 7 using Spearman correlation.