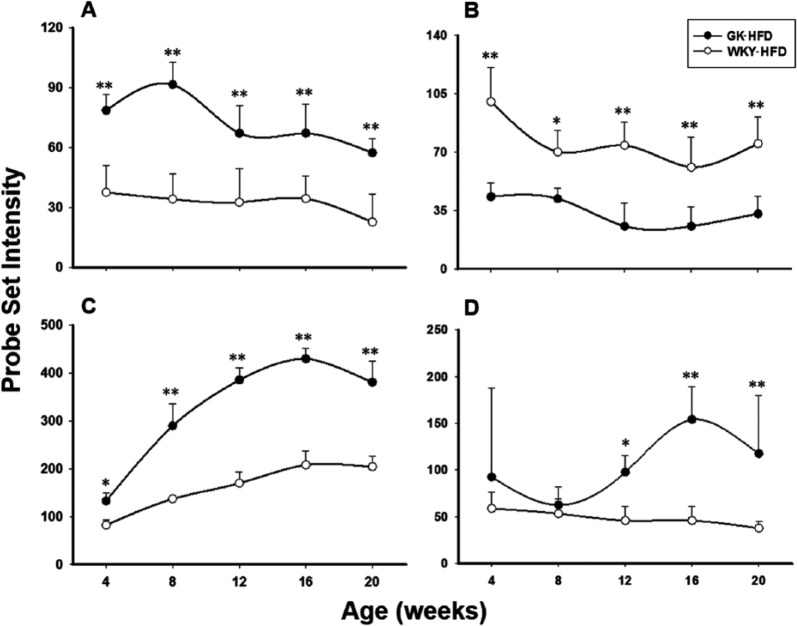
Figure 6.
HFD-dependent differences in gene expression between GK and WKY rats. Examples of differentially expressed genes between GK-HFD and WKY-HFD but not different when animals are fed a normal diet. (A) Psmb8, (B) Ip6k2, (C) Slc4a4, and (D) Tial1. Symbols represent mean values and error bars 1 SD of the mean. N = 5 animals per group. *P < .05; **P < .001. GK indicates Goto-Kakizaki; HFD, high-fat diet; WKY, Wistar-Kyoto.

