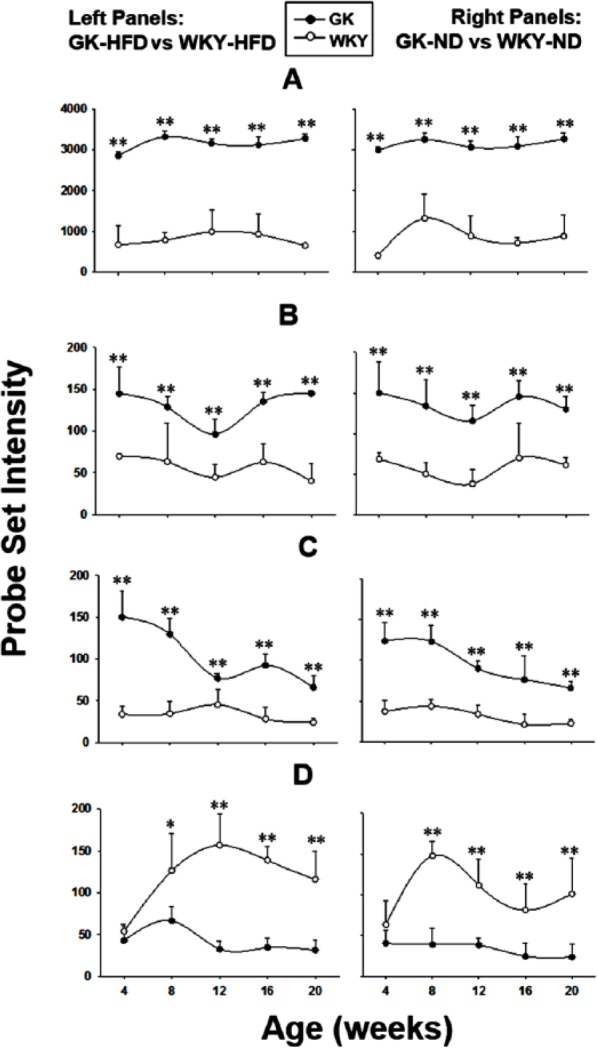
Figure 7.

Diet-independent differences in gene expression between GK and WKY rats. Examples of genes whose expression differs between GK and WKY animals, both when fed HFD (left panels) and ND (right panels). (A) Isca1, (B) Mrpl52, (C) Ifit1, and (D) Socs2. Symbols represent mean values and error bars 1 SD of the mean. N = 5 animals per group. *P < .05; **P < .001. GK indicates Goto-Kakizaki; HFD, high-fat diet; ND, normal diet; WKY, Wistar-Kyoto.
