FIG. 2.
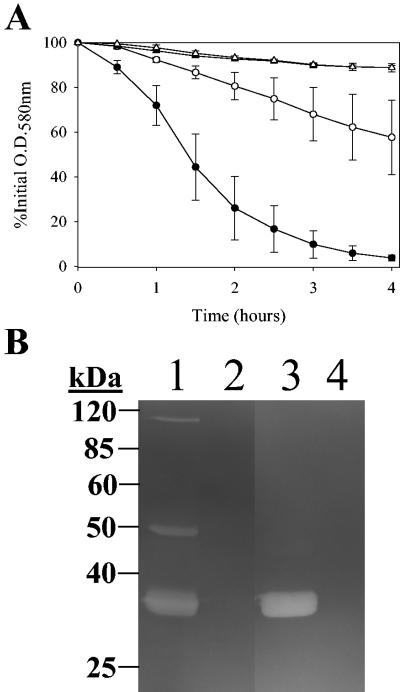
Quantitative cell wall hydrolysis assay (A) and zymogram analysis (B) of extracellular murein hydrolase activities of UAMS-1 and KB1050. (A) Aliquots of 50 μg of extracellular proteins isolated from 16-h cultures of UAMS-1 (wild-type; circles) and KB1050 (cidA mutant; triangles) grown in NZY broth in either the presence of 35 mM glucose (closed symbols) or in the absence of glucose (open symbols) were each added to a 1-mg · ml−1 suspension of M. luteus cell walls, and the murein hydrolase activity of each sample was measured as a decrease in turbidity over a 4-h time course experiment. These data represent the average of three independent experiments, and the error bars correspond to the standard errors of the means. (B) Fifteen micrograms of extracellular proteins, isolated from 16-h cultures of UAMS-1 and KB1050 grown in either the presence of 35 mM glucose or in the absence of glucose, was separated in a sodium dodecyl sulfate-polyacrylamide gel electrophoresis gel containing 1 mg of M. luteus cell wall · ml−1, followed by an overnight incubation at 37°C in a buffer containing Triton X-100 and staining with methylene blue. This zymogram is representative of results obtained from three independent experiments. The migrations of molecular mass markers (in kilodaltons) are indicated to the left of the gel. Lane 1, UAMS-1 (no glucose); lane 2, KB1050 (no glucose); lane 3, UAMS-1 (35 mM glucose); lane 4, KB1050 (35 mM glucose).

