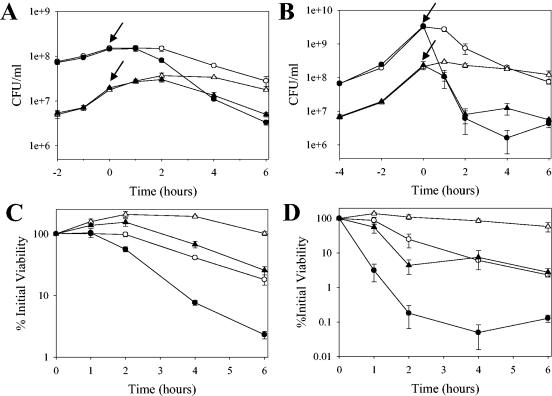
FIG. 3.
Comparison of the effect of glucose on antibiotic sensitivity between UAMS-1 and KB1050. Vancomycin (40 μg · ml−1) or rifampin (2 μg · ml−1) was added to cultures of UAMS-1 (wild-type; circles) and KB1050 (cidA mutant; triangles) cells grown in NZY broth in either the presence of 35 mM glucose (closed symbols) or in the absence of glucose (open symbols), and viable cell counts of each culture were determined by dilution plating on tryptic soy agar. These data represent the average of three independent experiments, and error bars correspond to the standard errors of the means. (A and B) Graphs depicting the CFU per milliliter of each culture before and after addition of vancomycin (A) or rifampin (B). The time at which each antibiotic was added to each culture is indicated by an arrow. (C and D) Graphs depicting the percent viability relative to the time of vancomycin (C) or rifampin (D) addition (referred to as the zero time point) for each culture.

