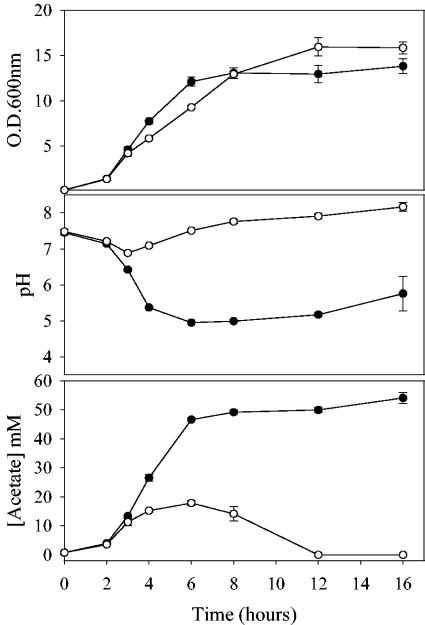
FIG. 5.
Comparison of the growth rate, pH, and acetate concentration in UAMS-1 cultures grown in the presence and absence of glucose. The growth rate, as determined by the OD600 (top graph), pH (middle graph), and acetate concentration (bottom graph), was measured in UAMS-1 cultures grown in NZY broth in either the presence of 35 mM glucose (closed circles) or in the absence of glucose (open circles). Each parameter represents the average of three independent experiments, and error bars correspond to the standard errors of the means.

