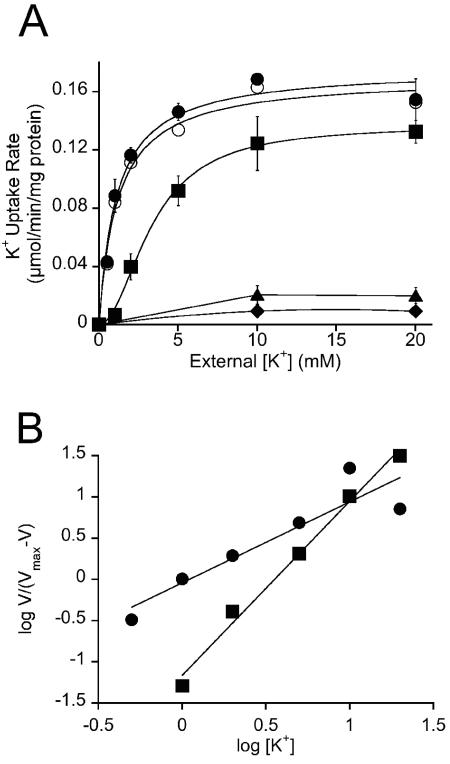
FIG. 3.
Kinetic analysis of K+ transport via TrkH and TrkI in H. elongata wild type and strains KB12 (ΔtrkI), KB15 (ΔtrkH), KB12.2 (ΔtrkH ΔtrkI) and KB14 (ΔtrkA). Osmolarity of growth medium and transport buffer was adjusted by 0.51 M NaCl. Transport was started by adding potassium to the assay. (A) Lowering the K+ concentration from 20 mM to 500 μM led to a decreasing transport rate. The K+ uptake data were fitted by nonlinear regression. The curve for K+ transport via TrkI into KB15 (•) and transport by the wild type (○) were fitted best by the Michaelis-Menten model and showed Km values of 1.12 and 1.18 mM K+, respectively. The transport data for TrkH in strain KB12 (▪) showed a sigmoidal dependence of transport rate versus K+ concentration. The half-saturation constant was determined to be 3.36 mM. Deletion of trkI and trkH abolished transport activity in strain KB12.2 (▴), proving that transporters TrkH and TrkI are responsible for the observed uptake of K+. No transport activity was measured for the ΔtrkA deletion mutant KB14 (♦), proving that trkA encodes the potential NAD binding protein for both TrkH and TrkI. Error bars indicate standard deviations. (B) Hill plot based on transport data from TrkI (•, KB15) and TrkH (▪, KB12) to evaluate the Hill coefficient h, which was estimated to be 0.98 for TrkI and 2.1 for TrkH. Values of h greater than 1 indicate a deviation of the Michaelis-Menten kinetics and can be used as an index of enzyme cooperativity (see Discussion). Symbols are as defined in the legend to panel A.

