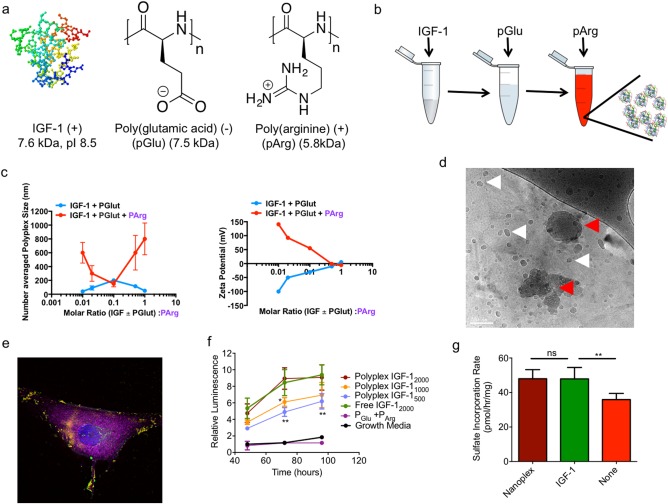
Figure 1.

Characterization of IGF‐1 containing nanoplex. (a) Structures and properties of polyelectrolyte materials used in the study (b) Schematic for generating IGF‐1 nanoplex materials. (c) Size and zeta potential as a function of polyelectrolyte molar ratios. (d) cryo‐TEM image of the generated IGF‐1 nanoplex. The white arrows indicate the location of a nanoplex and red arrows indicate nanoplex aggregates (scale bar: 100 nm) (e) Colocalization of the IGF‐1 nanoplex with CHON‐001 cells. The nucleus (blue), membrane (magenta), pArg (red), and IGF‐1 (green) have been stained. Yellow shows assembled nanoplex. (f) Bioactivity of IGF‐1 as measured by BrdU proliferation assay of CHON‐001 cells (n = 6 per condition, **p < .01, *p < .05) (g) Rate of cartilage tissue sulfate incorporation in response to treatment with 20 µM nanoplex, 20 µM IGF‐1 alone, or no treatment added to cartilage media consisting of DMEM, 10% FBS, non‐essential amino acids, pyruvate, HEPES, ascorbate, and proline (n = 10 per condition, **p < .01)
