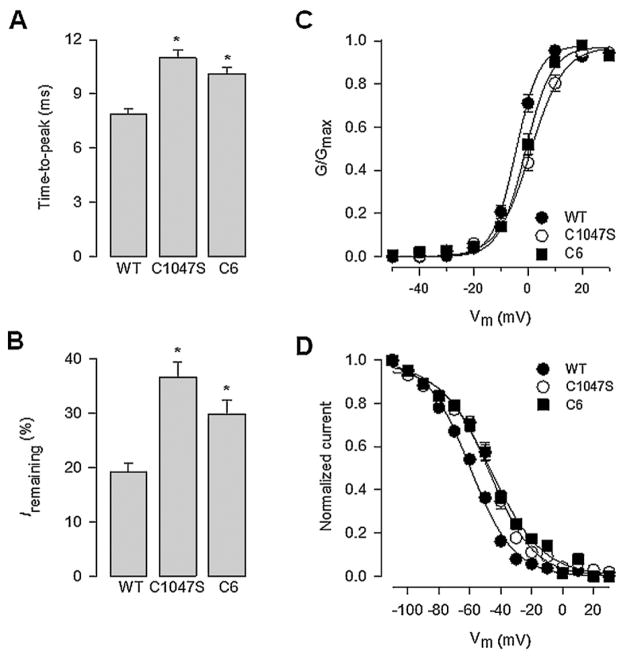
Fig. 3.
Effect of α2δ-1 WT and the Cys1047 mutant proteins on the properties of the currents through N-type channels recorded in HEK293 cells. (A) Bar chart comparing current time-to-peak recorded in response to a depolarizing pulse to +10 mV from a Vh of −80 mV in cells expressing the α2δ-1 WT, the Cys1047Ser or the C6 mutant subunits. (B) Proportion of non-inactivated current remaining at +10 mV in cells expressing the WT and the α2δ-1 mutant subunits as listed. (C) Voltage dependence of activation of CaV2.2/β3 channels co-expressed with α2δ-1 WT (filled circles), the Cys1047Ser or the C6 mutant proteins (open circles and filled squares, respectively). The normalized data, obtained from recordings such as those shown in Fig. 2C, are plotted against the test pulse. Relative conductance (G/Gmax) values were calculated and the data were fitted as described in Section 2. (D) Voltage dependence of steady-state inactivation of CaV2.2/β3 channels co-expressed with α2δ-1 WT (filled circles), Cys1047Ser (open circles) or the C6 mutant proteins (filled squares). Normalized data obtained from recordings such as those shown in Fig. 2C were plotted against the conditioning potentials. The mean data were fitted with a Boltzmann function.

