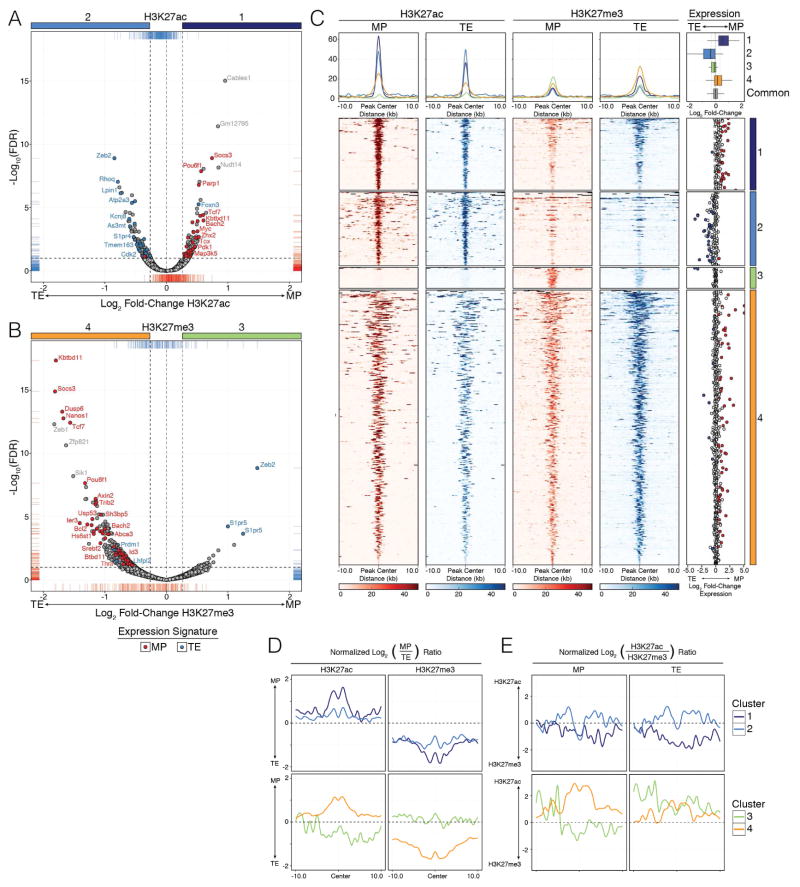
Figure 1. Higher levels of H3K27me3 deposition are a defining feature of TE cells compared to MP cells.
LCMV-specific KLRG1Hi IL7RLo (TE) and KLRG1Lo IL7RHi (MP) P14 CD8+ T cells were purified at d10 post LCMV-Armstrong infection and ChIP-Seq was performed for H3K27me3 and H3K27ac. See Supplemental Methods for details, but briefly, consensus peaks from replicate TE and MP samples were compared to identify “Common” regions or those that contain significantly differentially modified regions (DMRs) of H3K27me3 or H3K27ac (FDR (Benjamini-Hochberg) < 0.1 and fold-change > 1.2).
A–B) Volcano plots comparing differential deposition of (A) H3K27ac and (B) H3K27me3 between MP and TE cells were used to identify DMRs. Differential abundance of H3K27ac or H3K27me3 deposition [log2(Fold-change)] is plotted by [−log10(FDR)], where positive fold-change values represent higher deposition of the histone modification in MP cells and negative values represent higher deposition in TE cells. Horizontal dashed line denotes −log10(FDR) of 0.1, while vertical dashed lines denote a +/− log2 transformed fold-change of 1.2. DMRs associated to MP and TE gene expression signatures are labeled as blue and red dots, respectively. All remaining consensus peaks are referred to as “Common” regions between MP and TE cells (labeled as light gray dots).
C) Deposition of H3K27me3 and H3K27ac in MP and TE cells centered on DMRs +/−10kb as identified in volcano plots (A and B). Cluster 1 (dark blue) = H3K27ac deposition higher in MP than TE, Cluster 2 (light blue) = H3K27ac deposition higher in TE than MP, Cluster 3 (green) = H3K27me3 deposition higher in MP than TE, Cluster 4 (orange) = H3K27me3 deposition higher in TE than MP. Line plots at top show the summary distributions across each cluster for each H3K27ac and H3K27me3 in MP and TE cells, respectively. Scatter plots on far right show Log2(fold-change) of mRNA expression between MP and TE cells for the DMR-associated genes and summaries of entire gene expression distributions across Clusters 1–4 or Common consensus peaks are shown in boxplots.
D–E) Line plots show the ratios of H3K27ac or H3K27me3 deposition (normalized to Common consensus peaks, see Fig S1I) between MP and TE cells or within MP or TE cells for each cluster. Data shown contain the union of significant consensus peaks identified across two independent biological replicates of ChIP-Seq experiments for H3K27ac and H3K27me3 (A–E; n=10–20 mice/group/replicate). See also Figure S1.

