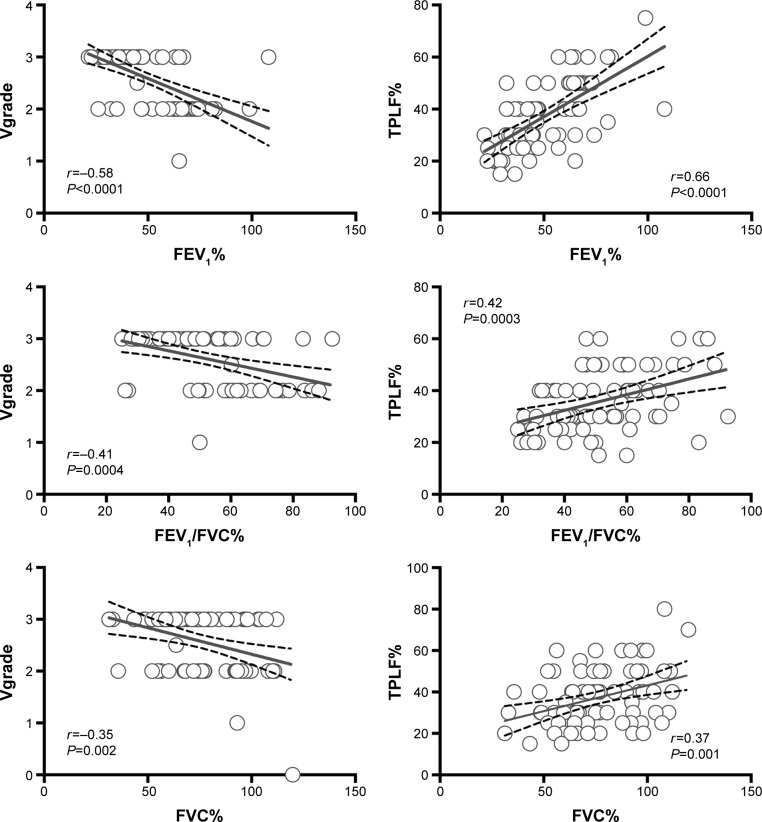
Figure 3.
Correlation between Vgrade and TPLF% and results of the technically accepted and reproducible pulmonary lung function tests.
Note: Pearson’s correlation coefficients and linear regression lines with best-fit values (continuous line) and 95% confidence intervals (dotted lines) are presented.
Abbreviations: FEV1, forced expiratory volume in 1 second; FVC, forced vital capacity; TPLF%, total preserved lung function; SPECT, single-photon emission computed tomography; Vgrade, penetration grade of Technegas in V SPECT.

