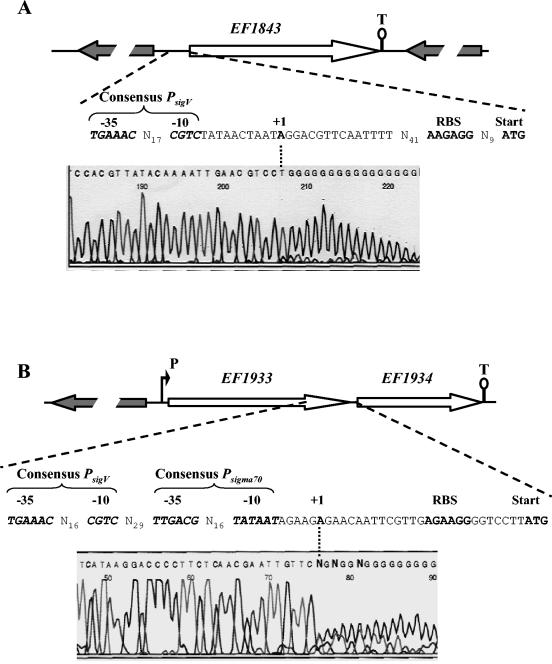
FIG. 9.
Schematic representation of the genetic organization of the EF1843 (A) and EF1934 (B) chromosomal regions of E. faecalis JH2-2 and respective electropherograms obtained from 5′ RACE PCR experiments. Large arrows represent the ORFs, and their orientation shows the transcriptional direction. The putative promoter (P) and Rho-independent terminators (T) are shown. Sequences in the electropherograms were obtained with specific primer SP3 (Table 2) and dG-tailed cDNA. The last base (A) upstream of the dG tail corresponds to the first nucleotide transcribed (TSS), which is in boldface and designated +1. The −10 and −35 motifs of the promoter sequences, the ribosome binding site (RBS), and the start codons are shown.

