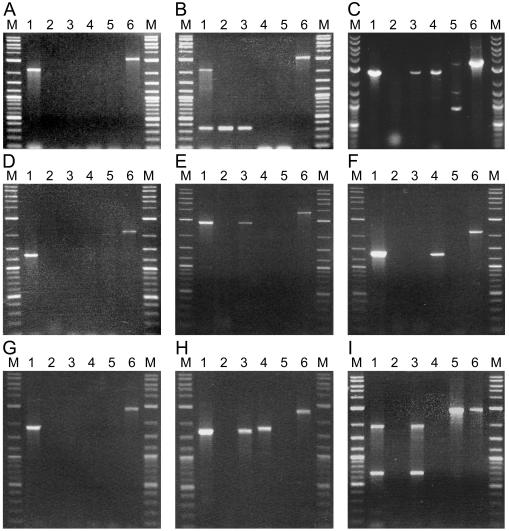
FIG. 5.
PCR analyses of N2-grown cultures derived from complemented mutants. Panels correspond to analysis of total DNA, as template, from wild-type Anabaena sp. strain PCC 7120 (lanes 1), or (in lanes 2) the following mutants: FQ885 (alr2825) (A); FQ57 (alr2827) (B); FQ1631 (alr2831) (C); FQ773 (alr2832) (D); FQ470 (alr2833) (E); FQ428 (alr2837) (F); FQ794 (alr2839) (G); FQ1630 (alr2840) (H); FQ344 (alr2841) (I). Lanes 3 to 6: complemented strains FQ885 plus pRL2875, FQ57 plus pRL2864, FQ1631 plus pRL2862, FQ773 plus pRL2863, FQ470 plus pRL2865a, FQ428 plus pRL2877, FQ794 plus pRL2876, FQ1630 plus pRL2873, and FQ344 plus pRL2866. Lanes M are New England BioLabs 2-log DNA size-standard markers (10, 8, 6, 5, 4, and 3 kb [bright]; 2, 1.5, 1.2, and 1.0 kb [bright]; 0.9, 0.8, 0.7, 0.6, and 0.5 kb [bright]; and 0.4, 0.3, 0.2, and 0.1 kb). Primers were ORF-specific P3 and P4 (lanes 1 to 3), P2 plus P3 (lanes 4), P1 plus P4 (lanes 5), and P1 and P2 (lanes 6), specific for the ends of the cloning region of pRL1383a and its derivatives pRL2831a and pRL2831b. In the panels (see inset table F of Fig. 4), the band in lane 1 shows the size expected for wild-type DNA, indicating the efficacy of P3 and P4 to prime the expected PCR with genomic DNA; lanes 2 lack any band other than from primer dimerization, indicating that segregation of the mutations was complete; and lanes 3 show in several instances (panels C, E, H, and I) the presence of a band in the complemented mutant, indicative of double recombination having taken place in these recombination-proficient cells. Single recombination shown by bands in lanes 4 and 5 is discussed in the text. The band in each lane 6 shows the size expected for the plasmid added to the corresponding strain, indicating the efficacy of P1 and P2 to prime the expected PCR with the plasmid present in total DNA from the complemented strain.

