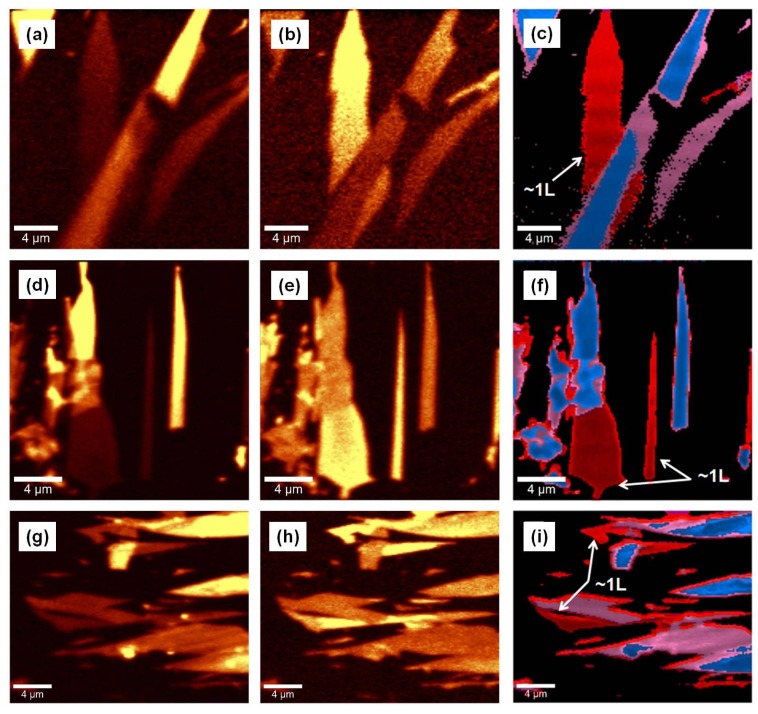
Figure 2.
Confocal Raman mapping images screening: (a,d,g) the location of the G band; and (b,e,h) the location of the 2D band. Yellow pseudo-color in the images corresponds to higher intensity of the filtered Raman feature; (c,f,i) Images preformed with Cluster Analysis software (Ulm, Germany) revealing a mixture of a single-layer and a few-layers of graphene. The arrows mark the presence of a single-layer of graphene in the samples.

