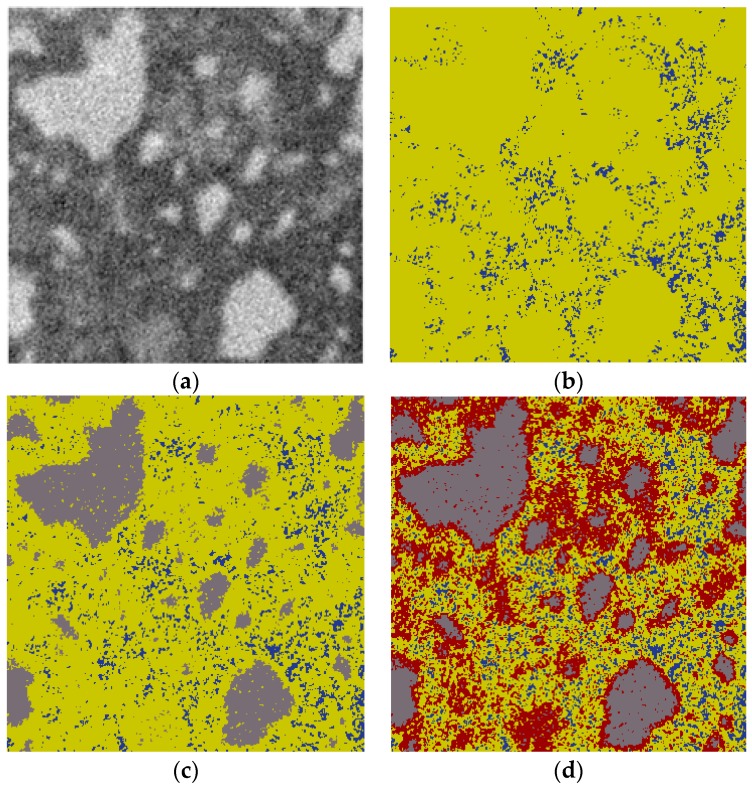
Figure 6.
2D Schematic view of image segmentation process: (a) original grey-scale map; (b) pore (blue) and solid phases (yellow) are isolated from the grey-scale map; (c) anhydrous cement (grey) and hydration product (yellow) are isolated form solid phases; (d) outer product (yellow) and inner product (red) are segmented from hydration product.

