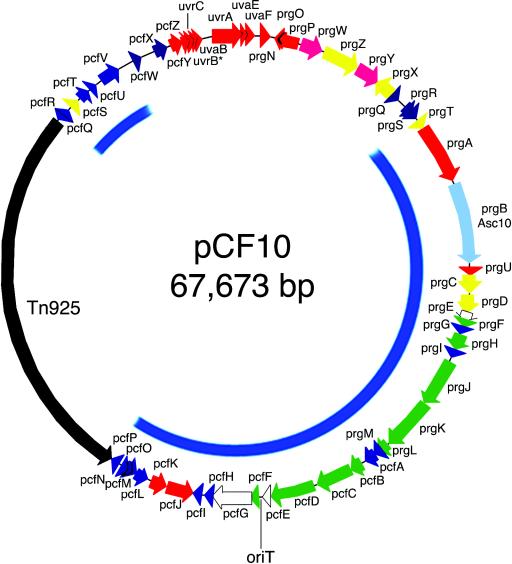
FIG. 1.
Physical map of plasmid pCF10. Putative ORFs and their orientations are shown. The colors indicate the closest homology of the protein products to E. faecalis plasmids pAD1 (red), pAM373 (yellow), pPD1 (magenta), pRE25 (orange), and pTEF2 (blue). ORFs found only on pCF10 are purple. Regions with homology to chromosomal regions of S. agalactiae NEM316 are indicated in green, and similarities to L. lactis are shown in white. The blue inner circle indicates the region of 95 to 97% homology on the nucleotide level between the plasmids pCF10 and pTEF2.

