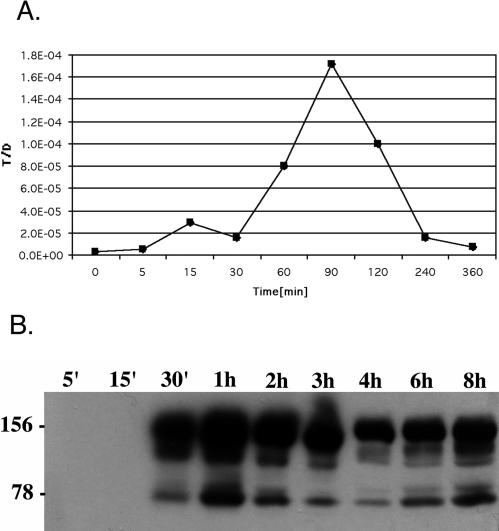
FIG. 4.
Phenotypic effects of pheromone induction. (A) Plasmid transfer. Donor OG1RF(pCF10) was induced with 100 pg of cCF10/ml. At the indicated time points, donor cells were added to the recipient OG1SSp. After a 10-min mating, donor and transconjugants were enumerated as described in Materials and Methods. The graph represents the T/D frequency. (B) AS expression. OG1RF(pCF10) was induced with 100 pg of cCF10/ml. Surface extracts were prepared at the indicated time points. Protein extracts were separated on an 8% polyacrylamide gel electrophoresis gel, and AS was detected by Western blot analysis with AS-specific antibodies. Equivalent amounts of protein were loaded in each lane. The 156- and 78-kDa markers represent the full-length and amino-terminal segment of AS.

