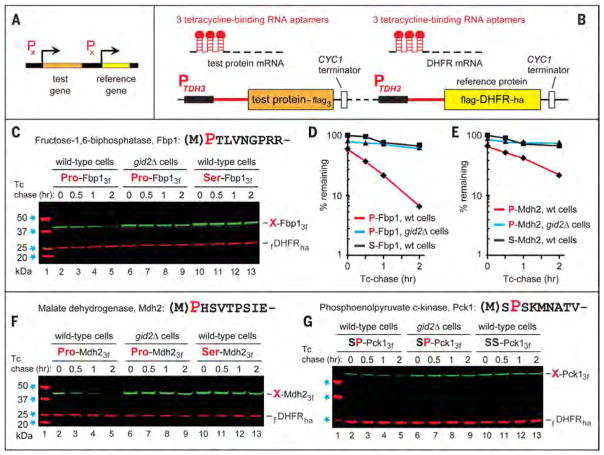
Fig. 2. The promoter reference technique and the degradation of gluconeogenic enzymes.
(A and B) The promoter reference technique (PRT). (C) Lane 1, kDa markers. Tetracycline-based chases were performed at 30°C during transition from ethanol to glucose media with wild-type (lanes 2 to 5 and 10 to 13) or gid2Δ S. cerevisiae (lanes 6 to 9) expressing either wild-type P-Fbp13f (Pro-Fbp1) or S-Fbp13f (Ser-Fbp1). At the indicated times of a chase, proteins in cell extracts were fractionated by SDS–polyacrylamide gel electrophoresis followed by immuno-blotting with antibody to Flag. (D) Quantification of data in (C). All chases in this study were performed at least twice and yielded results that differed by less than 10%. (E) Quantification of data in (F). (F) Same as (C) but with P-Mdh23f and S-Mdh23f. (G) Same as (C) but with SP-Pck13f (Ser-Pro-Pck1) and SS-Pck13f (Ser-Ser-Pck1). The N-terminal sequences of Fbp1, Mdh2, and Pck1 are shown at the upper right of (C), (F), and (G), respectively. The bands of test proteins and the fDHFRha reference protein are indicated.

