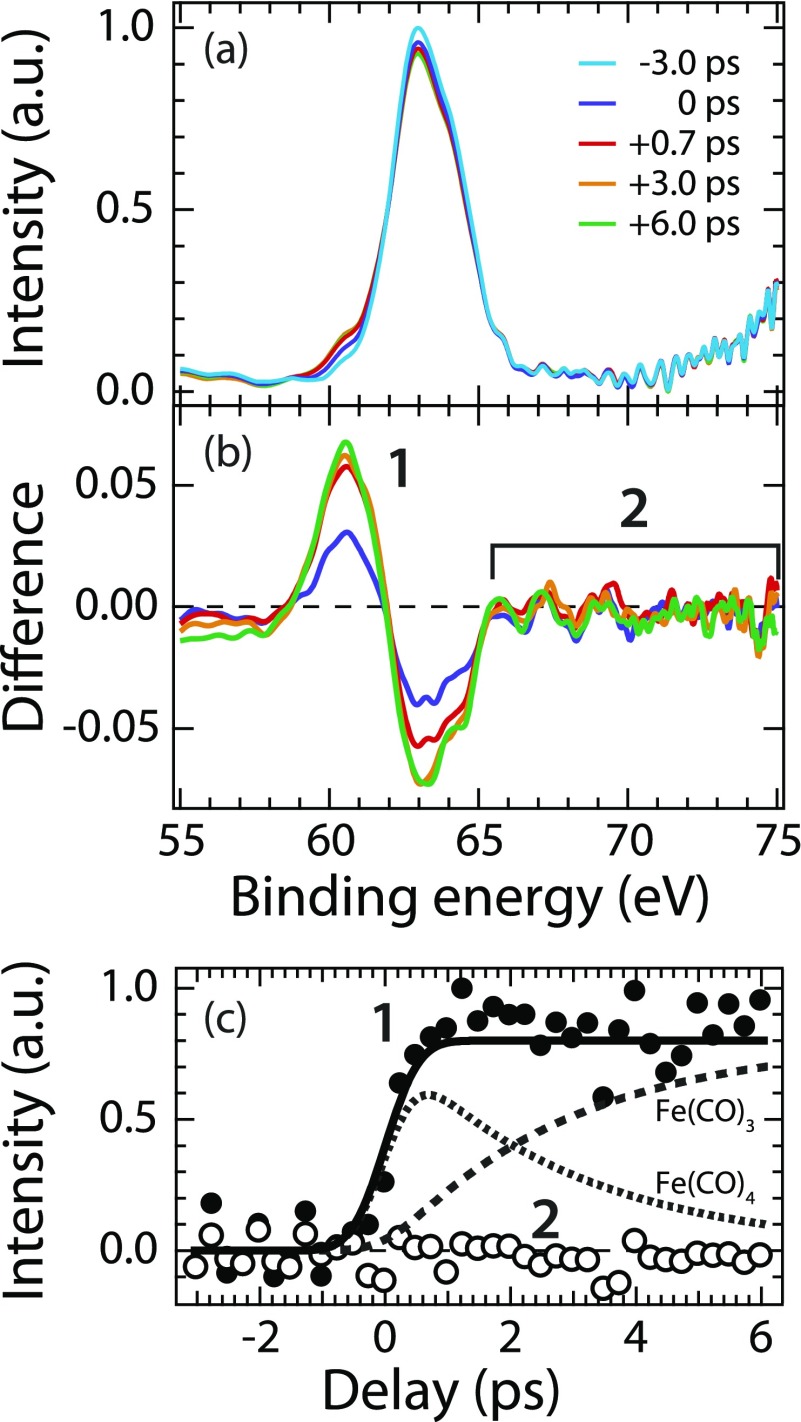
FIG. 3.
(a) Fe 3p core-level photoelectron spectra of Fe(CO)5 at indicated delay times after excitation at 266 nm (photon energy 123 eV, intensity of the −3.0 ps spectrum normalized to one at maximum). (b) Difference spectra (the spectrum corresponding to unpumped molecules at −3 ps was subtracted from the intensities at the given delays). (c) Integrated intensities versus pump-probe delay time of the Fe(CO)4 and Fe(CO)3 peak (1, closed circles, integration interval 58.5–62 eV, intensities normalized to one at maximum) and of the high-energy side of the Fe 3p peak (2, open circles, integration interval 65.5–75 eV) with the kinetic model (solid lines) taken from Fig. 2 without changes.

