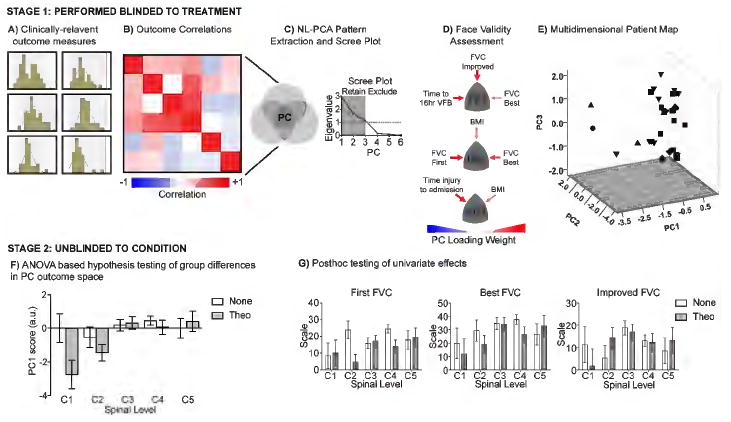
Figure 1. Statistical analysis workflow.

(A) Data distribution of each clinically relevant outcome was assessed to determine the type of statistical tests to use. (B) Correlation matrix of all outcomes used to perform (C) non-linear principal component analysis (NL-PCA) to identify 3 principal components (PC) based on both having eigenvalues greater than 1 whose (D) multivariate outcomes also had face validity to the clinicians that collected the data. (E) Composite PC scores from each multivariate outcome was assigned to each patient and used to map each subject into a 3D space based on their syndromic outcomes generated with NL-PCA. Workflows A-E were all conducted blinded to treatment condition. (F) Hypothesis testing was performed on multivariate outcomes (PC1-PC3) for interactions between type of treatment (group 1 vs group 2) and SCI spinal level on the multivariate space. (G) Individual outcomes tested with the same hypothesis using univariate statistics, demonstrating that only the multivariate outcomes are sufficiently powered for hypothesis testing, whereas individual outcomes separately cannot reliably test these hypotheses.
