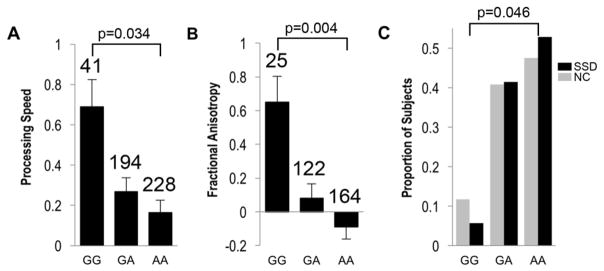
Figure 1.
Rs8234 and joint phenotype analysis. A. Mean normalized processing speed values for rs8234 genotypes. B. Mean normalized whole brain fractional anisotropy values for rs8234. The number above each genotype is the number of individuals with that genotype. Error bars represent standard error. C. Proportion of schizophrenia spectrum disorder patients (N=193) (black color bar) and controls (N=360) (grey color bar) for the three genotypes of rs8234. SSD: Schizophrenia Spectrum Disorder. NC: Community controls.

