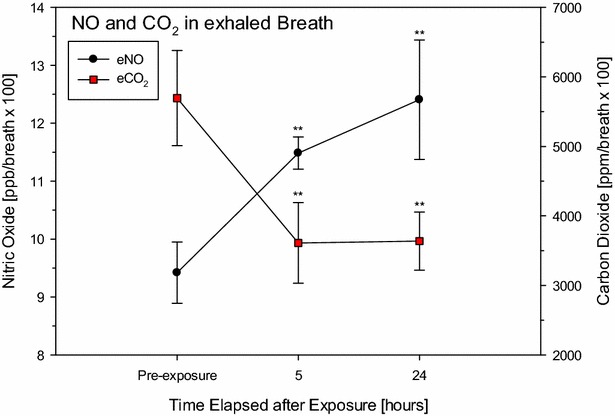
Fig. 6.

Measurement of exhaled eNO and eCO2 of rats 5 and 24 h post-phosgene exposure (for details see [43, 44, 46]). Sham control rats (denoted pre-exposure) served as concurrent control. Exhaled NO, CO2, and respiratory rate were digitally recorded every 10 s over a time period of 10 min. Data points represent means ± SD (n = 3). Values were normalized to 100 breaths. Asterisks (*) denote significant differences to the air control group (**P < 0.01)
